

Here’s How Much Revenue NPR and PBS Stand to Lose
Semipublic projects PBS could lose around 15% of their total yearly revenue due to federal funding cuts, while NPR could lose less than a tenth. Both numbers spell trouble.


In the late hours of July 17th, the House of Representatives took the final vote to rescind public media’s federal funding for the next two years. NPR’s CEO, newcomer Katherine Maher, as well as longtime PBS CEO Paula Kerger both responded to the action within hours.
“This vote is an unwarranted dismantling of beloved local civic institutions, and an act of Congress that disregards the public will,” Maher wrote in an eight-paragraph press release. She added later, “Despite promises from some Members of Congress to fix anything the bill breaks, this will be an irreversible loss. If a station doesn't survive this sudden turn by Congress, a vital stitch in our American fabric will be gone for good.”
Kerger, on the other hand, opted for a more succinct statement. “Many of our stations which provide access to free unique local programming and emergency alerts will now be forced to make hard decisions in the weeks and months ahead,” she wrote. “There is nothing more American than PBS.”
Both underscored the undeniably devastating effect the end of federal funding would have on the stations that paid for their programming. (Semipublic has covered this topic extensively, start here to understand which public media station relied on federal funding the most, then here to understand which are most at risk of closing and why.) But Kerger and Maher stop short of talking about how the cuts could affect their respective networks.
The metrics often cited by journalists are that NPR relied on federal funding for “less than 1%” of their total revenue, while PBS and its stations (there’s never been a true estimate for just the network) relied on federal funding for “about 15%” of their total revenue. But the loss of the Corporation for Public Broadcasting will have a cascade effect on the finances of the public media system, especially for its two flagship networks, and the real danger NPR and PBS are in is much greater than they let on.

Earlier this year, I set out on a journey to collect every public media station’s financial documentation. I wanted to answer the question of what would happen when public media lost its federal funding.
Since launching Semipublic in April, my work has been featured nationally and has inspired other journalists to generate their own data-driven insights about public media. It even laid the groundwork for Adopt A Station, a website I built in 24 hours that pairs visitors with an at-risk public media station.
Altogether, the work to gather, analyze, and publish the industry’s essential data has taken me hundreds of hours. Now, I’m asking for your help: If you value Semipublic’s mission, or have ever benefited from insights published in this newsletter, take the time to become a paid subscriber for $8 a month. Or, you can buy me a coffee.
Reinventing the (Fly)wheel
Just want the TLDR? Click here.
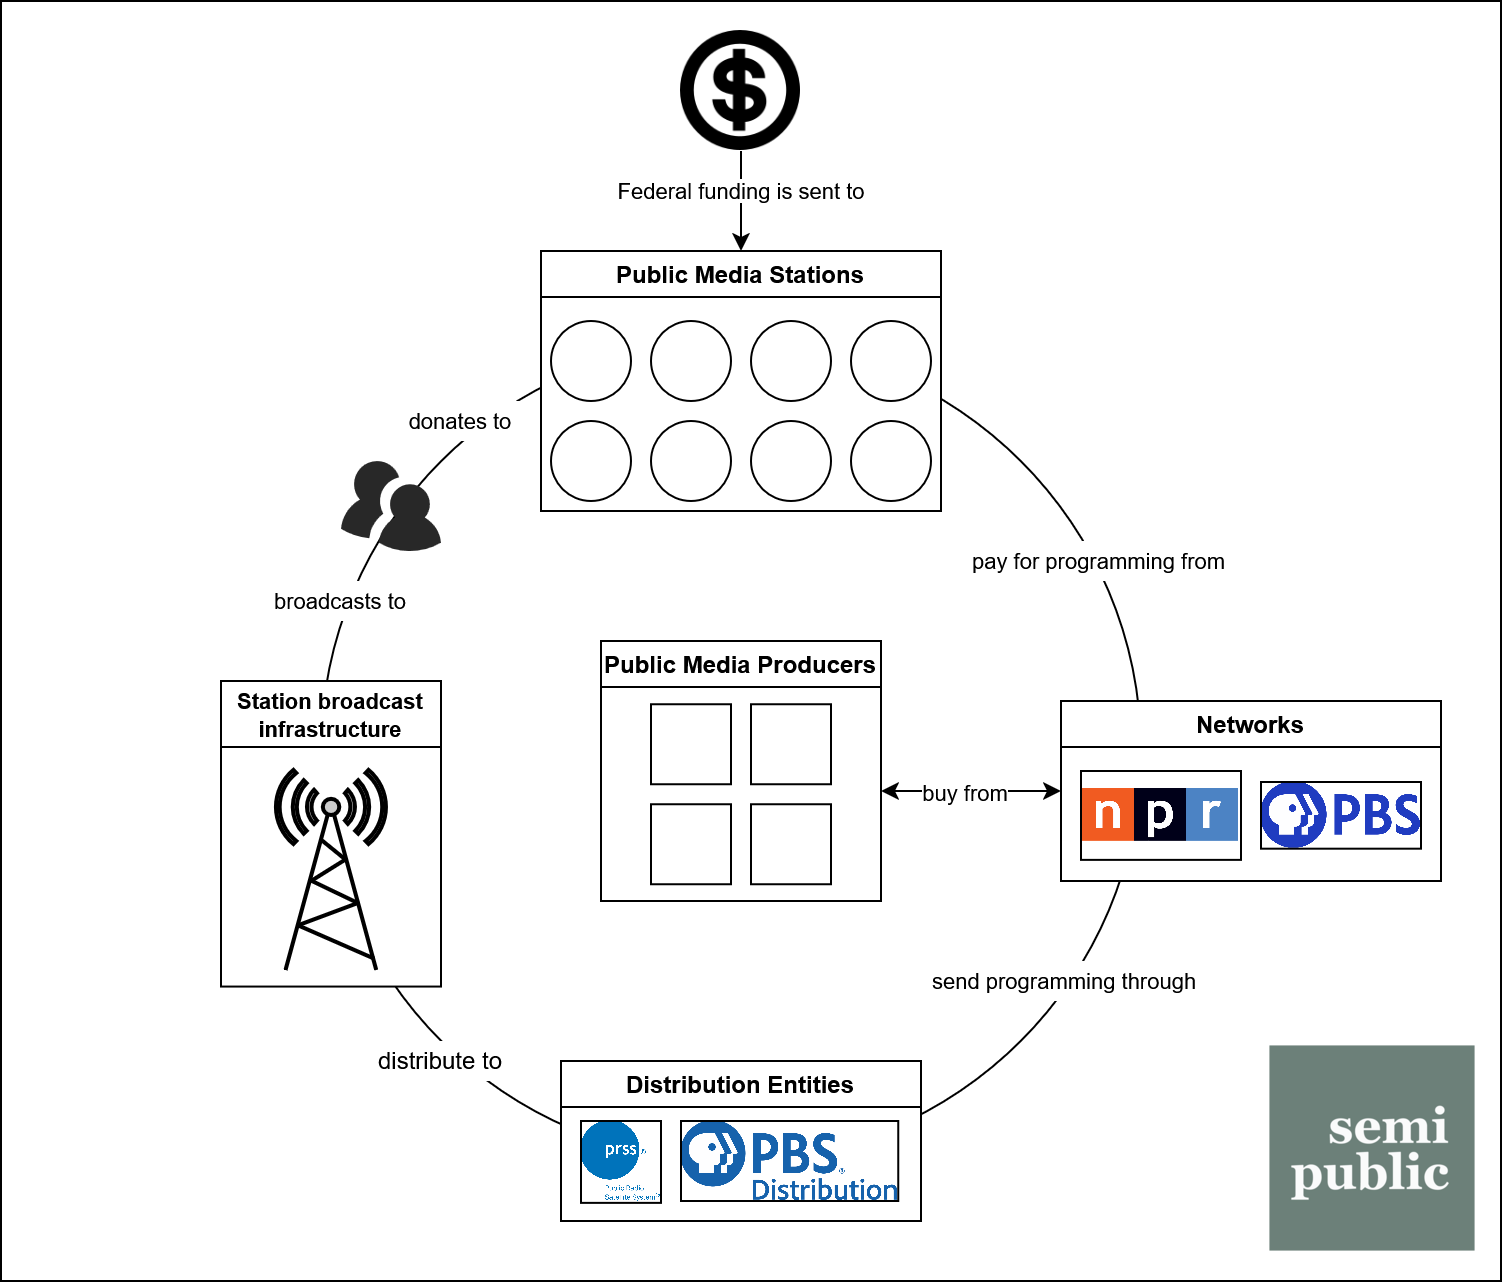
When President Trump issued an executive order halting any federal funding to NPR or PBS back in May, I wrote a long newsletter breaking down the EO, as well as how public media’s finances had worked (up until now). In it, I described how, once it finds its way to stations, federal funding enters a self-propelled “flywheel” of financial transactions and movements. CPB grants prop up local stations, who pay networks and producers for their programming, who distribute the programming to stations, who broadcast to listeners, who donate to the station, who pay networks and producers for their programming…ad infinitum.
The point is that federal funding allows both stations and networks to create demand for each other. And when that federal funding is interrupted, so too is the demand.
On the whole, NPR and PBS are probably better positioned to survive the end of federal funding than local stations are, but their reliance on funding from local stations is often understated. In 2024, for example, programming fees and station assessments made up over 30% of both PBS’s and NPR’s total revenue. That’s certainly more than how much stations rely on either small gift donations or federal funding - two major sources of station revenue - on average.
As we’ll discuss later, a loss of even a fraction of these fees combined with the loss of federal grants creates a scenario extremely similar, if not, in some instances, more extreme, to the one local stations are facing at this very moment.
How to Calculate Network Revenue Loss
As you might expect, the financial disclosures of public media’s largest networks are rather complicated. 990s are normally my gold standard for comparative analysis because the questions are uniform across all non-profits, but what we’re looking for - specific breakdowns of revenue by department - doesn’t necessarily exist.
Which leaves audited financial statements.
Our chief concern in calculating network revenue loss is separating out all federal funding from total revenue, as well as any programming or distribution revenue from stations, so that we can calculate total loss based on stations that ranked “Critical” on the Curley C-Score. Unfortunately, like local stations, the AFSes of NPR and PBS are difficult to compare because, apart from a dozen or so required financial metrics, the two go into detail about revenue, expenses, assets, and liabilities differently.
Let’s start with NPR:
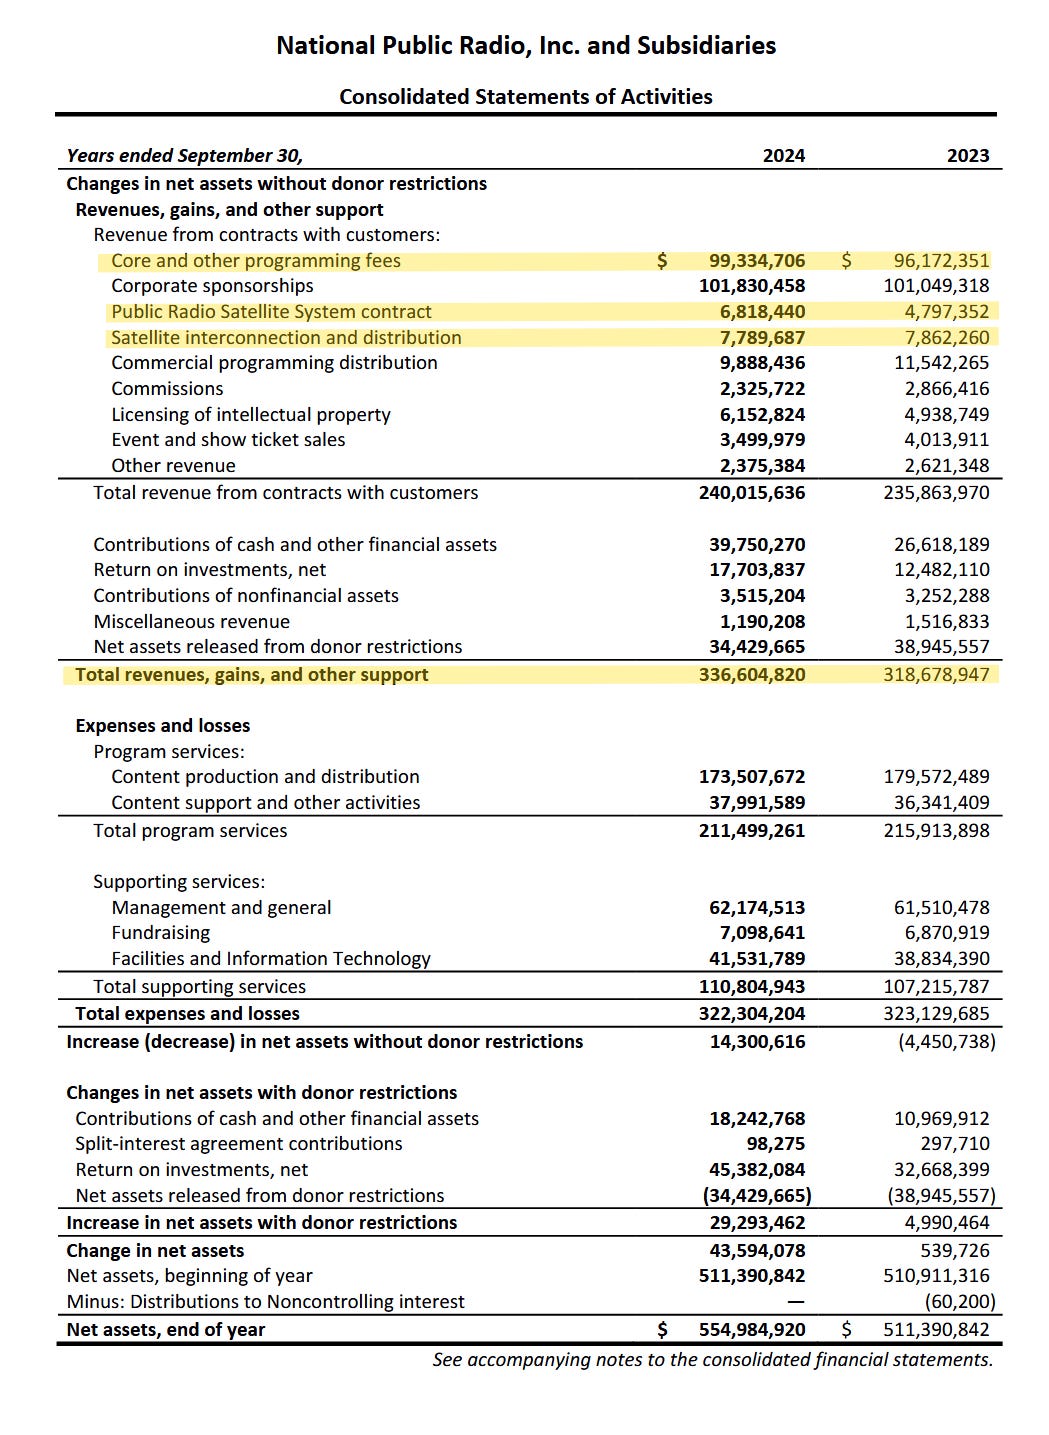
We want to know the network’s total revenue for last year. That’s easy: about $336 million. We also want to know how much revenue NPR made from its member stations. That’s “Core and other programming fees:” About $99 million. Later, we will subtract what I’ve estimated to be the station fees of “critical” stations from NPR’s total revenue based on the most recently reported fee structure.
Unfortunately, NPR does not supply a neat and tidy accounting of all CPB funds appropriated to them. Fortunately, CPB does: $6.7 million went to interconnection (distribution) while another $6.9 million went to programming and support.
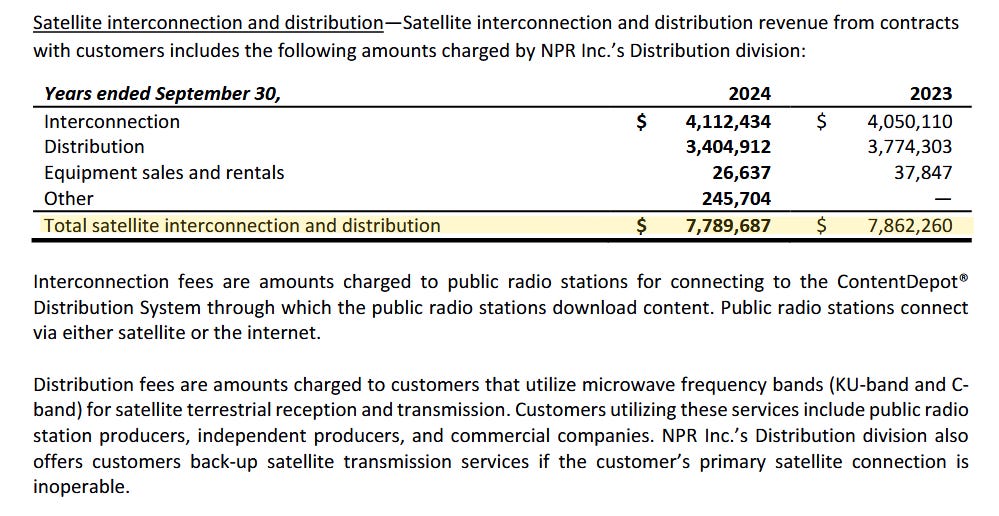
The last piece of the puzzle is distribution revenue from customers, which is distinct from core and other programming fees. Because NPR lumps all distribution revenue together in the consolidated revenue section, we have to scroll down 22 pages to find that PRSS made $7.8 million in revenue from customer contracts. We’ll multiply this number by PRSS’s reported fee structure later.
Now to PBS:
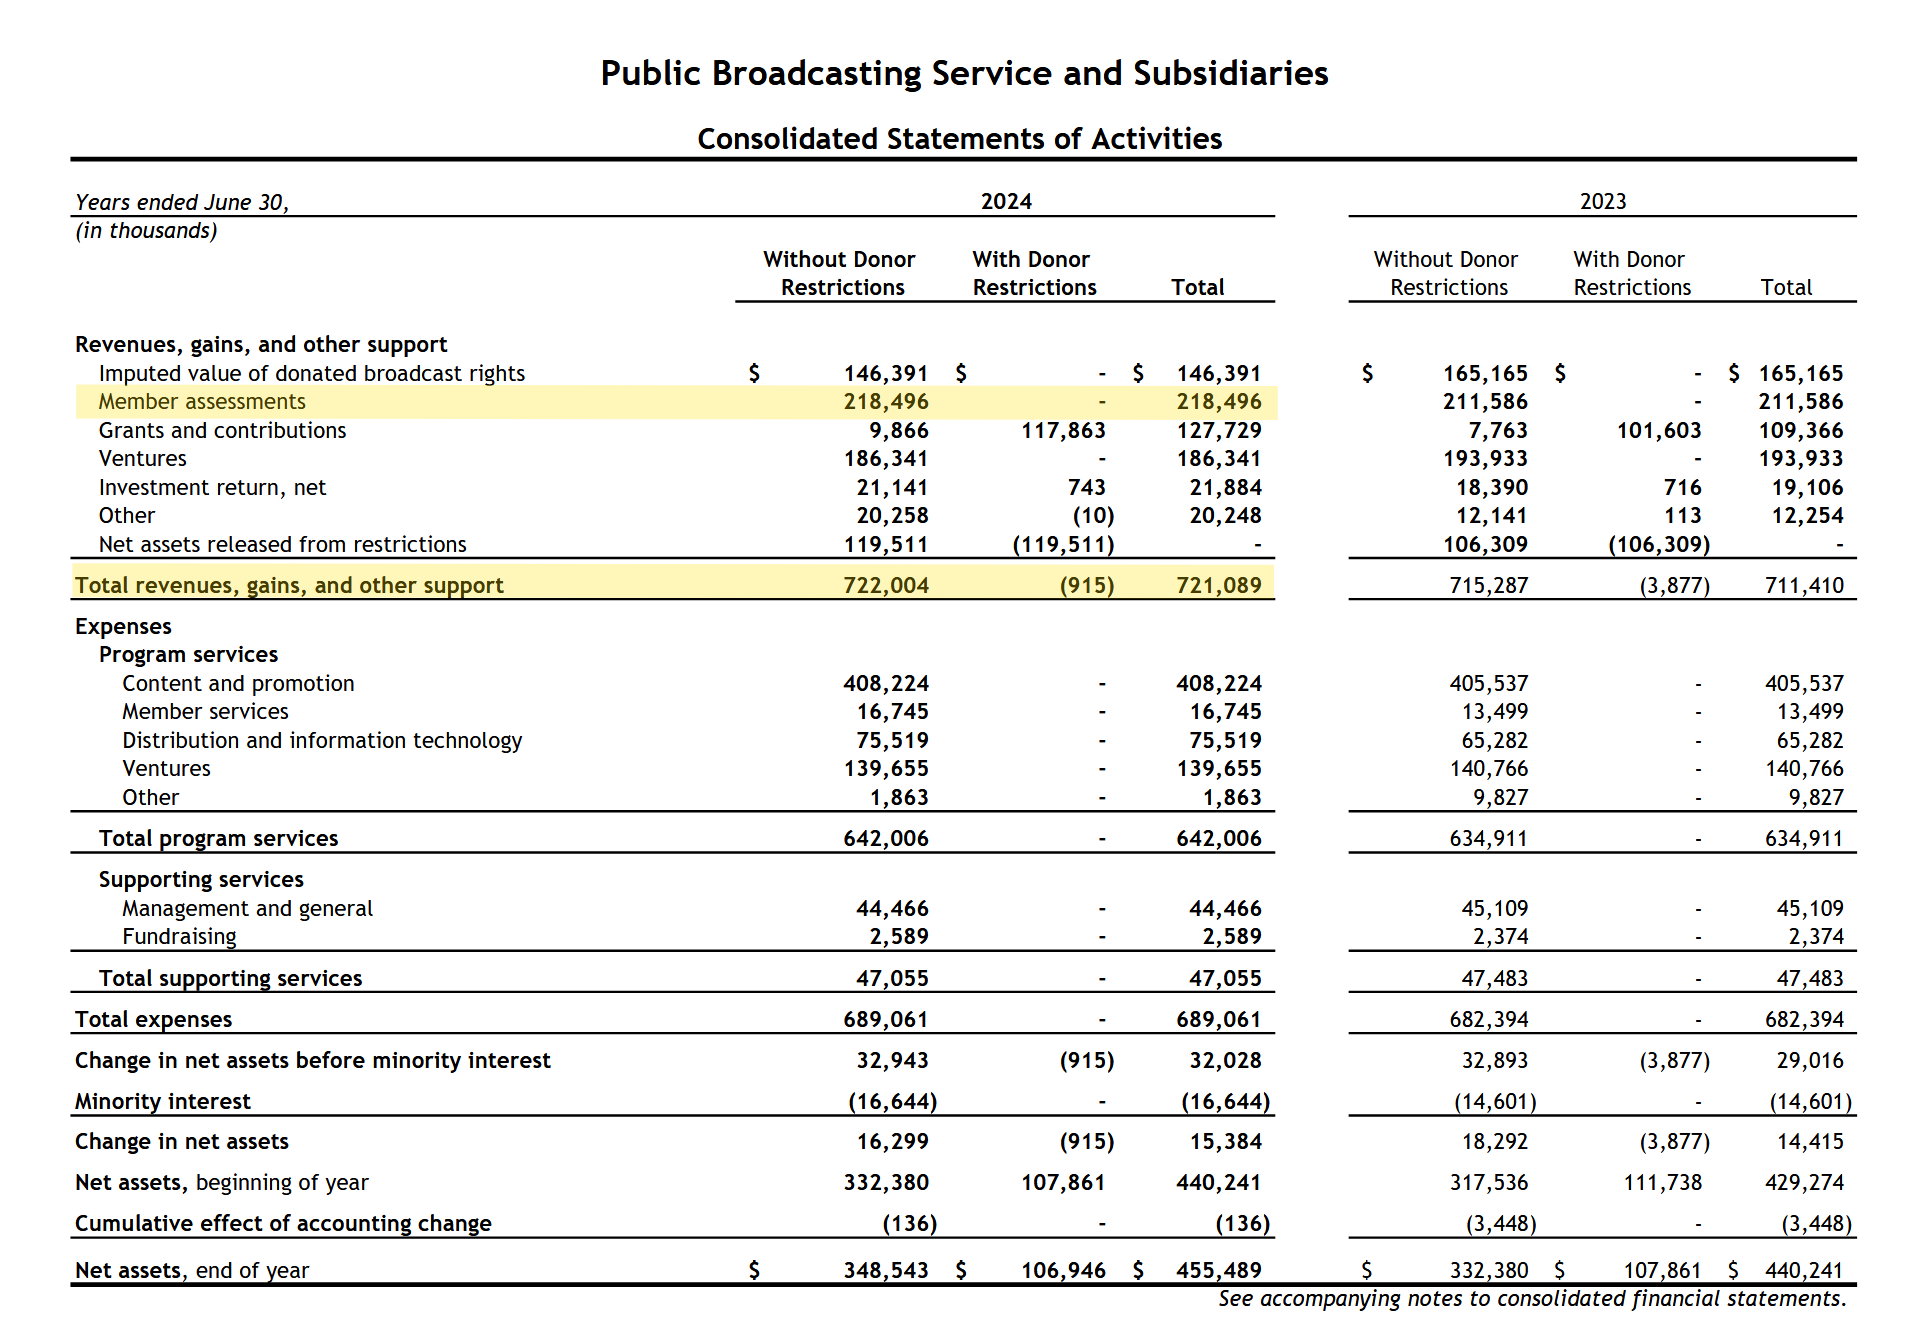
As before, finding the total revenue is easy: $721 million. So are member fees, or “assessments:” $218 million. Again, we’ll have to go to CPB’s website for an accounting of PBS’s grants: $20 million for interconnection and $57 million for programming and operational costs.
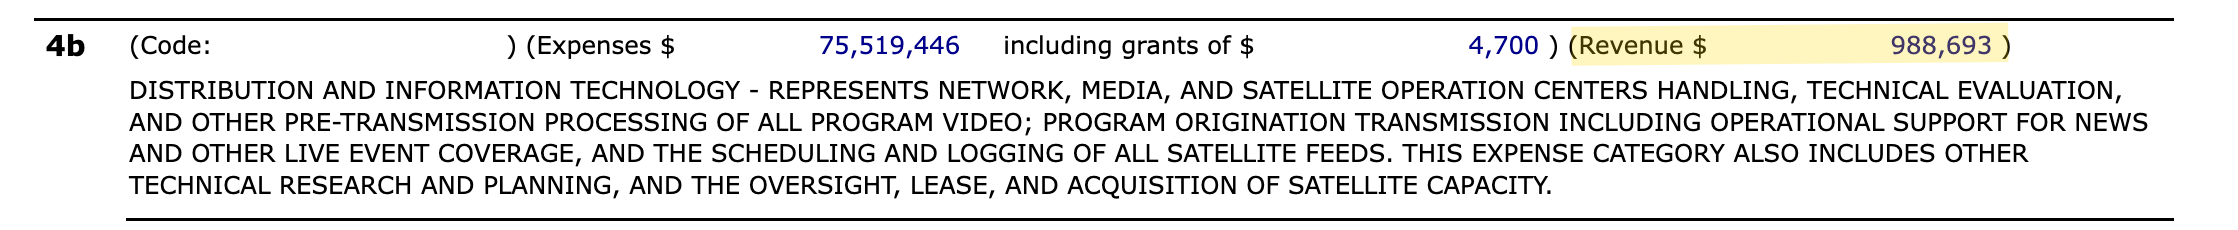
Unlike NPR, PBS does not list their distribution revenue on their AFS, so we have to dig into their 990. Section III of the first page states that their distribution services made about $989,000.
Factoring in At-Risk Stations & Fees
Several weeks ago, I applied the “Curley C-score” to station finances with federal funding subtracted from total revenues. The C-score is a predictive model to tell when a station may encounter financial distress and at what severity - but at its core, it’s the sum of three non-profit ratios that I found to be the most predictive of financial distress that have undergone a Z-score normalization. By normalizing the ratios, the model becomes self-referential: Instead of having to arbitrarily decide which ratios may or may not be “good,” we can look at the normalized values and know how many standard deviations they are from the mean of the entire dataset.
The sum of those three normalized values gives the actual “C-score,” and I determined that any score -3 or below qualified a station as being in “critical” financial distress. Or, put another way, at risk of closing in the next three years.
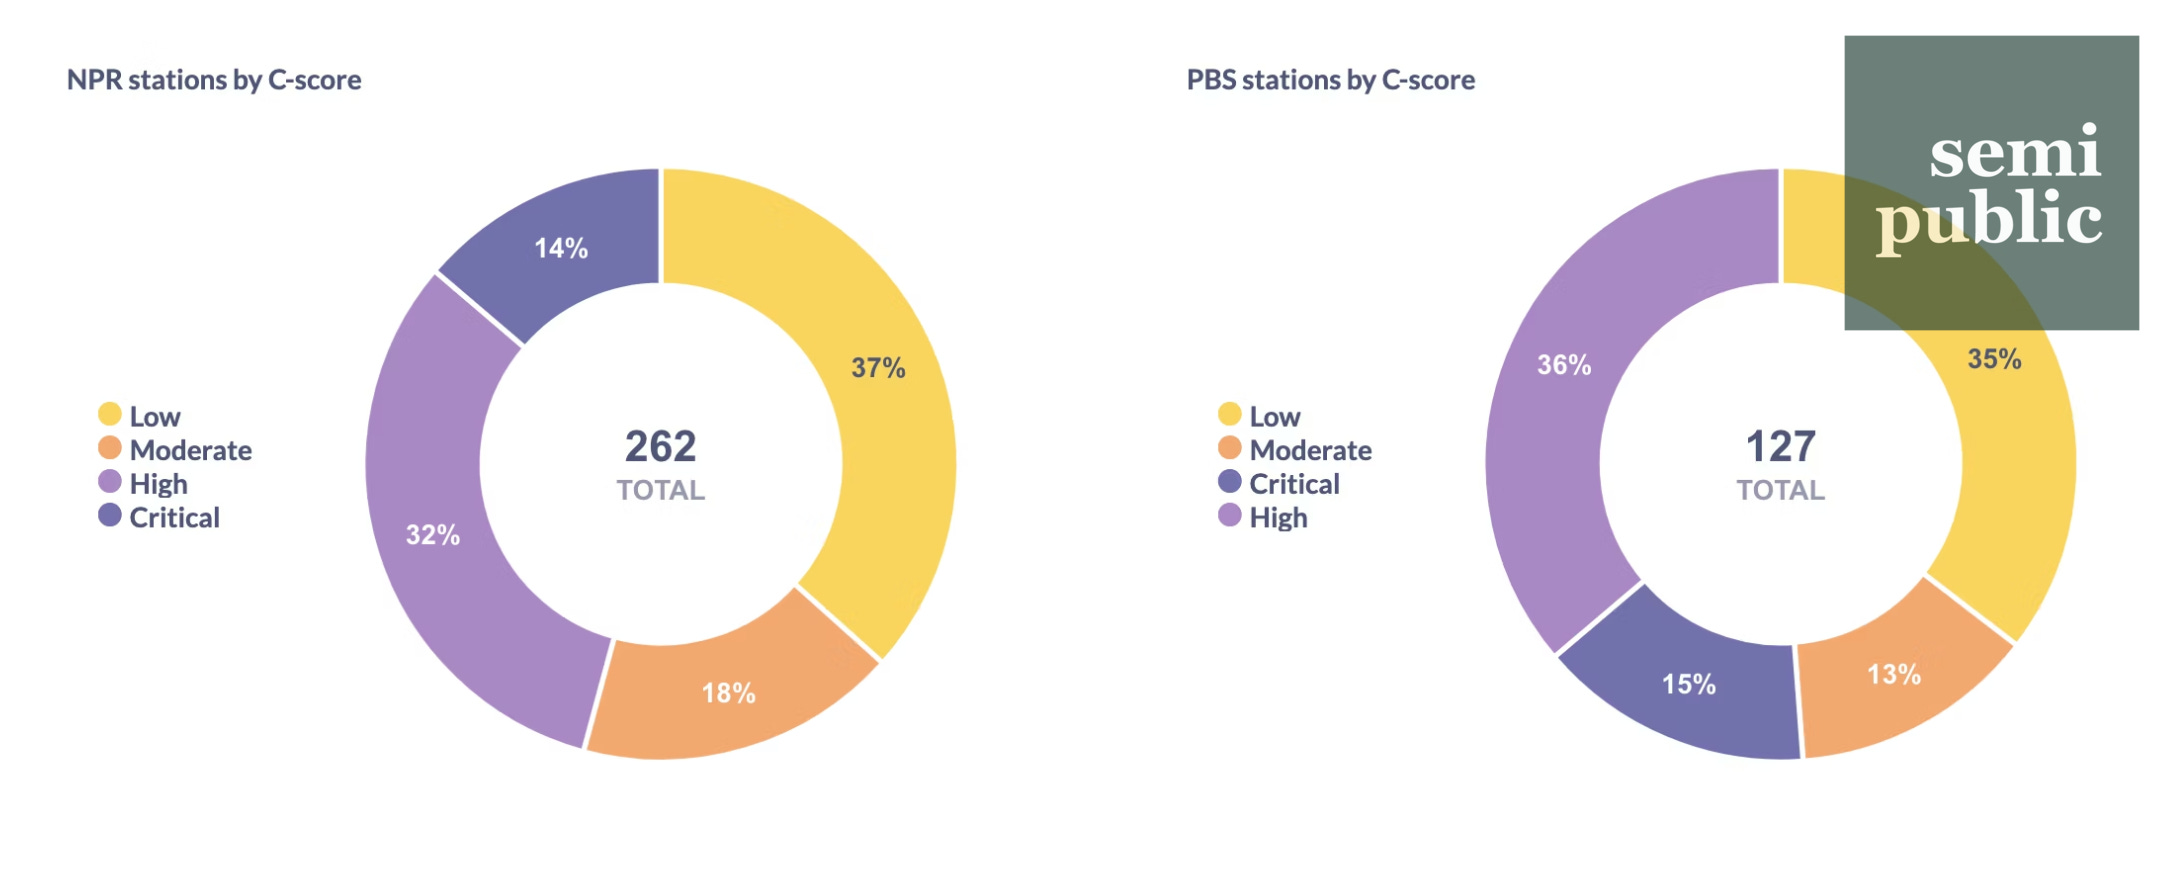
Of the 262 NPR stations I had data for, 36, or 14%, were identified by being at “critical” risk by my model. For PBS, my model identified 19, or 15%, of 127 stations. In order to arrive at a more precise calculation for revenue loss among the two networks, we’ll need to apply both the programming and distribution fee formulas to each of the critical stations and subtract those numbers from total revenue.
Let’s start with NPR:
The most up-to-date programming fee structure I could find on the internet was published in Current in late 2019. It describes a fee ladder based on how much membership revenue a station brings in every year. The first $250,000 is multiplied by 33.5%, the next $250,000 multiplied by 30.5%, etc.
When applied to all 36 critical NPR stations, my estimated loss in programming fees comes out to a total of about $14.5 million. That’s about 15% of NPR’s total programming fee revenue.
As for PRSS station fees, their website states that stations pay a base of 2% of their total station revenue. There are many other complicated fees and add-ons stations pay for, as well as revenue-based fee caps, but let’s keep it simple for now: 2% of the total revenues for critical NPR stations is about $2.2 million, or about 28% of PRSS’s station revenue.
Now for PBS:
Unfortunately, we’re at much more of a disadvantage since PBS’s member fee structure is a closely-guarded secret. Here’s how Julian Wyllie of Current recently described the latest fee structure changes:
The [new] model would group stations into six tiers based on a three-year average of their gross [nonfederal financial support, or NFFS]: small, medium, medium-large, large, extra large, and extra extra large stations. A station’s tier would determine its base fee. It would then pay an additional amount based on its net NFFS. PBS declined to say how many stations would be in each tier.
The ambiguous tiers and even-more-ambiguous additional fee make it nearly impossible to come up with a formula to apply to each station individually.
In its stead, we will take our first shortcut by multiplying PBS’s total member assessments by the percentage of its stations that have been identified as critical: 15% of $218 million gives us an estimated assessment fees loss of around $33 million.
Because information about PBS Distribution fees is limited, we’ll take the same shortcut: 15% of $989,000 is about $148,000.
Now that our fee calculations are complete, we can finally predict the total revenue losses for NPR and PBS.
The Final Calculations
Disclaimer: Once again, these numbers are projections and do not reflect the networks’ current reality. They are the result of a months-long throughline of several different calculations and estimates - if you are curious about how I arrived at this moment, I would recommend starting with this newsletter’s first post and working forward. Additionally, NPR and PBS directly employ thousands of humans, most of which are currently wondering about their own futures. When I discuss labor actions such as layoffs, I am only writing in comparative terms and not as a certainty.
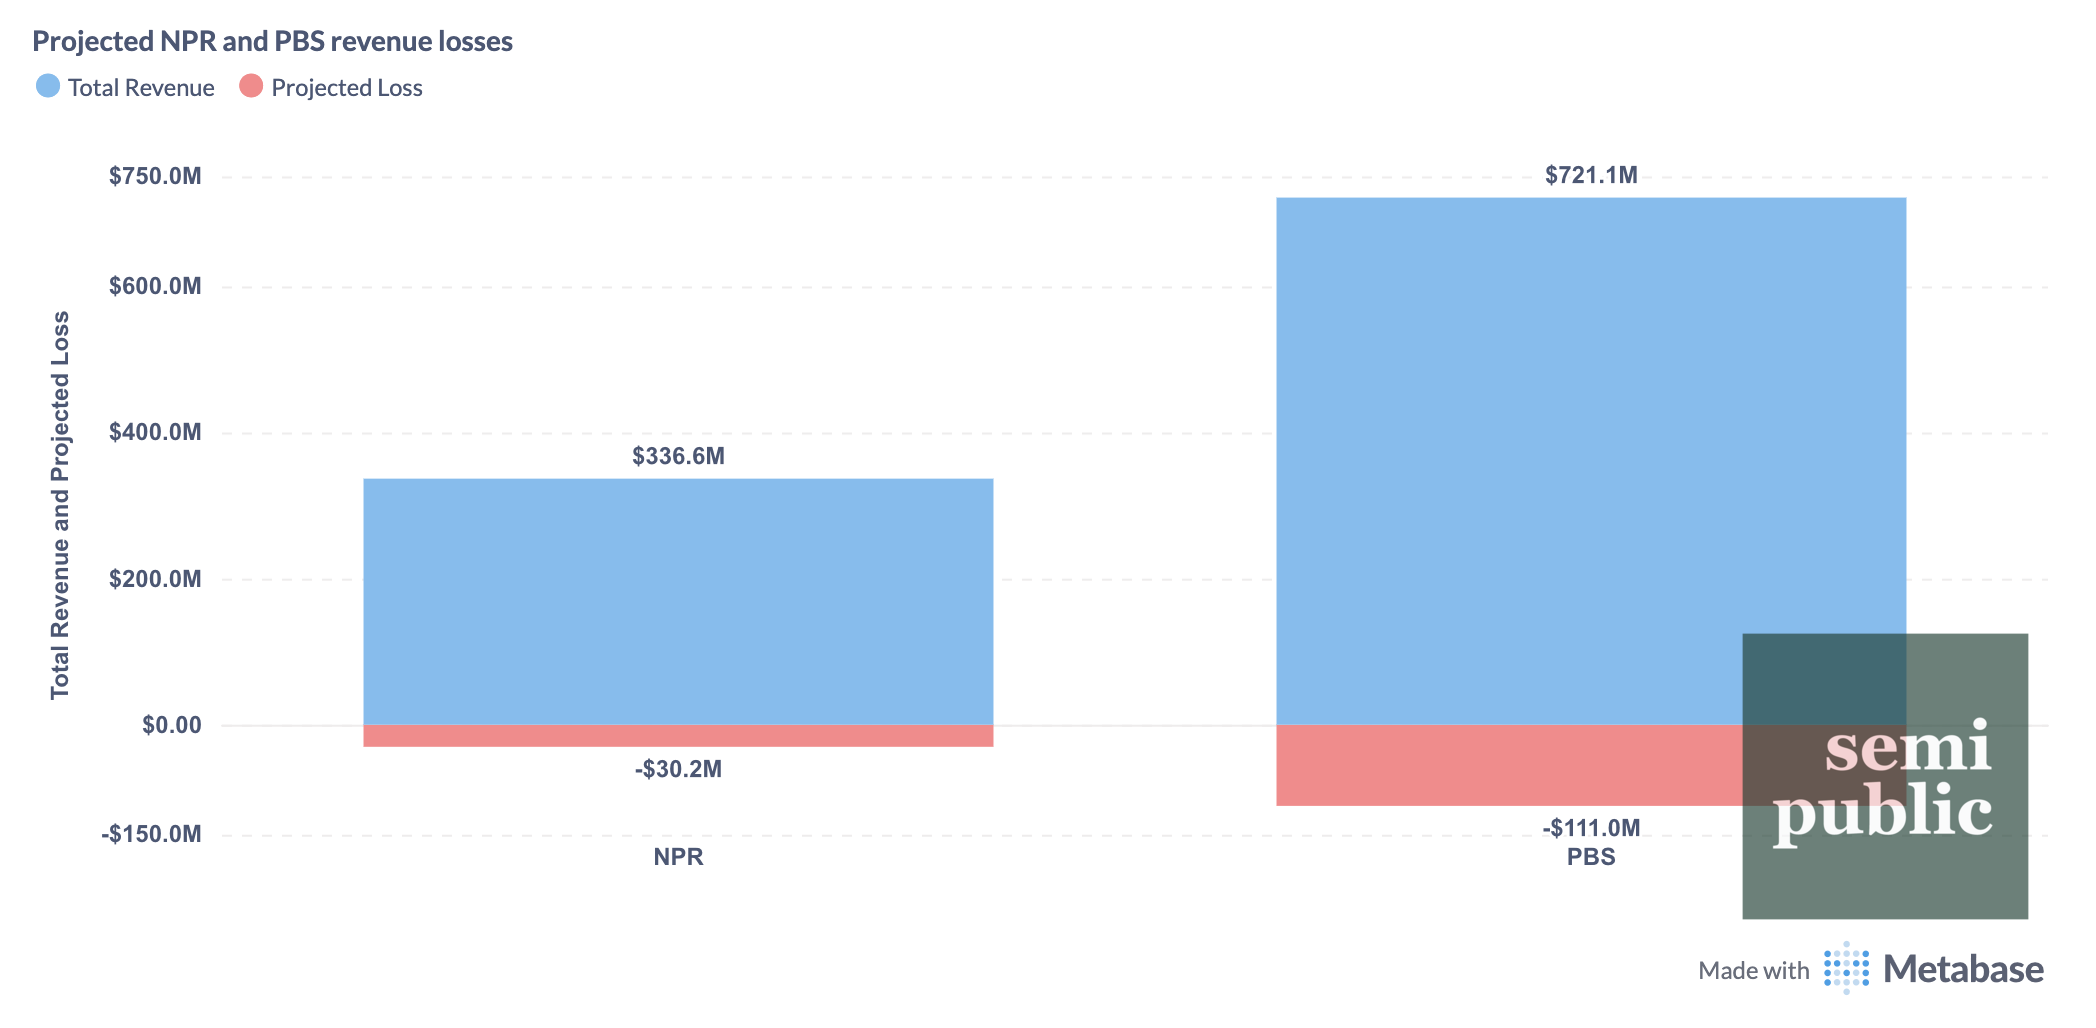
When added together, NPR’s CPB grant totals from FY24 ($6.7 and $6.9 million), its estimated fees for stations at critical risk of closing ($14.5 million) and its estimated PRSS fees for those same stations ($2.2 million) equals a total estimated revenue loss of around $30.2 million, or 9% of their total yearly revenue.
Similarly, PBS’s CPB grant totals ($20 and $57 million), plus its estimated assessments for critically at-risk stations ($33 million), and its estimated station distribution fees ($148,000) equals a total estimated revenue loss of around $111 million, or 15% of their total yearly revenue.
These numbers are quite striking, mostly because there are several public media stations that are seemingly better-positioned to ride out the end of federal funding than NPR or PBS are.
They’re also striking because NPR enacted a 10% reduction-in-force in 2023 for a nearly identical budget shortfall. The network’s CEO has also promised to cut NPR’s budget by $8 million in order to send that money to its network stations. I can’t find any modern data on layoffs at PBS, but it’s not difficult to imagine that the budget shortfalls that prompted them during the Great Recession as well as the pandemic were similar to my current projection of 15%.
Add to the mix the great uncertainty stations will be facing after the first CPB grant checks fail to arrive in October for the first time in over 5 decades: Stations fighting for their very existence (and resisting some rumored frequency sale offers by other broadcasting networks) may look at their balance sheets and decide that they simply cannot pay the fees NPR or PBS are demanding. That’s not to say that local stations don’t necessarily need network programming to fundraise with or even to fill 24 hours, but the current outcry of sympathy for local stations among the public could create a rather unique bargaining position.
I always want to make sure that I state this clearly: Public media will survive the end of federal funding. But, based on my projections, it’s clear that local stations are not the only entities that will be facing some difficult financial challenges.
The revenue losses NPR and PBS are potentially facing are significant, and they’re happening at a time of a forced reinvention. How the industry’s flagship networks respond to those challenges over the next 6 months to a year will be critical for their survival.
As always, here’s an interactive dashboard of some of the metrics discussed in this newsletter. If you enjoyed this post, please consider supporting me with a paid subscription, or by buying me a coffee.