

No Kings Protests Were Public Media’s Biggest Facebook Moments of 2025
A study of over 113,000 Facebook posts by public media stations showed that No Kings demonstrations in June and October set user engagement records.


It’s been a very big few weeks for me personally. Not just because of Semipublic and Adopt A Station’s television appearance, or our non-profit announcement, or our GoFundMe, or any of our other media appearances, but because my wife and I welcomed our second child into the world.
Things have been incredibly overwhelming since then, especially with forming the non-profit, so I need to acknowledge this from the start of today’s newsletter: My writing output is going to decrease for the next few weeks. Semipublic isn’t going anywhere - in fact, I’m currently adding several incredibly complicated systems to our data-gathering arsenal and growing the organization - but my tired newborn brain is a limiting factor.
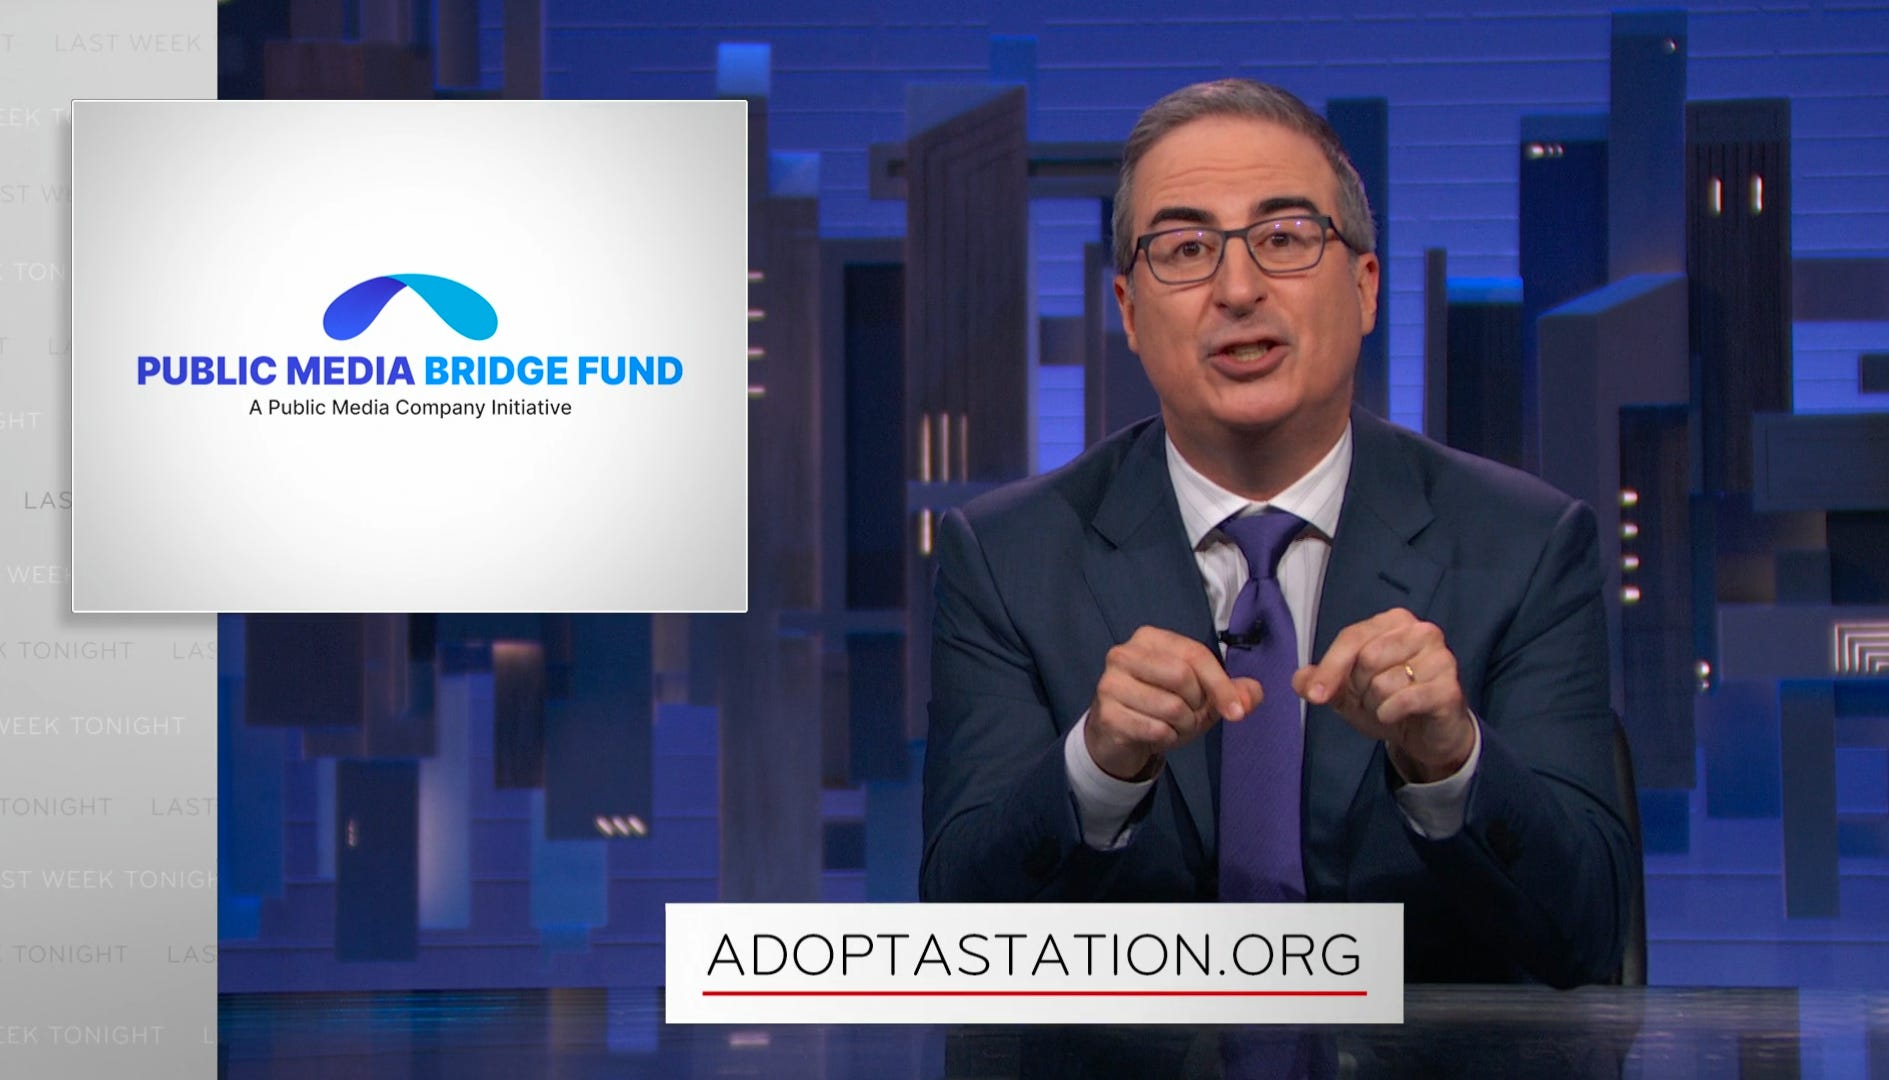
Also, as you may or may not know, Semipublic and Adopt A Station recently made a big appearance on Last Week Tonight with John Oliver’s season finale. I was very lucky to have been able to help guide the show’s writers as they were crafting the show and I think the final product is a perfect encapsulation of Semipublic’s new non-profit mission: Our information was used both as a backbone and a primary, quoted source of data for what was an incredibly good and detailed primer on public media and what’s happened with its federal funding viewed by untold thousands of people. We were also able to compliment that understanding with a product viewers could take direct action on: Adopt A Station.
We are a central place for data and insights about an industry in flux - and when we can, we make impactful products based on those data and insights.
Now that we’ve demonstrated impact, we’re launching our own non-profit to grow it even more. Data collection and analysis is expensive and time-consuming: If you value what we do at Semipublic, help us out by giving to our GoFundMe.
Okay, on with today’s newsletter:
It’s been over two decades since Mark Zuckerberg and his Harvard roommates launched Facebook. According to the Pew Research Center, apart from YouTube, there are no other social media sites that beat Facebook’s audience hold on any demographic, including age, gender, income, and race and ethnicity.
It should be no surprise, then, that 85% of public media stations run and regularly post to a Facebook account. It is the most ubiquitous digital platform in the industry, beating out Instagram (only about 80% of stations use the image-based social media platform) and is second only to stations websites.
Unfortunately, social media trends in public media aren’t very well understood. That’s why Semipublic recently embarked on a mission to collect every Facebook post by a public media station between January 1, 2025 and now, over 113,000 entities.
For our first analysis, we wanted to answer a simple question: What content moved the needle with public media Facebook users this year?
It probably won’t be a surprise to hear that, since the rescissions package passed in July, I’ve spent most of my time thinking about how that’s affected public media as an industry. Coming into this analysis, my assumption was that it played a significant part in stations’ Facebook post strategy. Turns out, it didn’t.
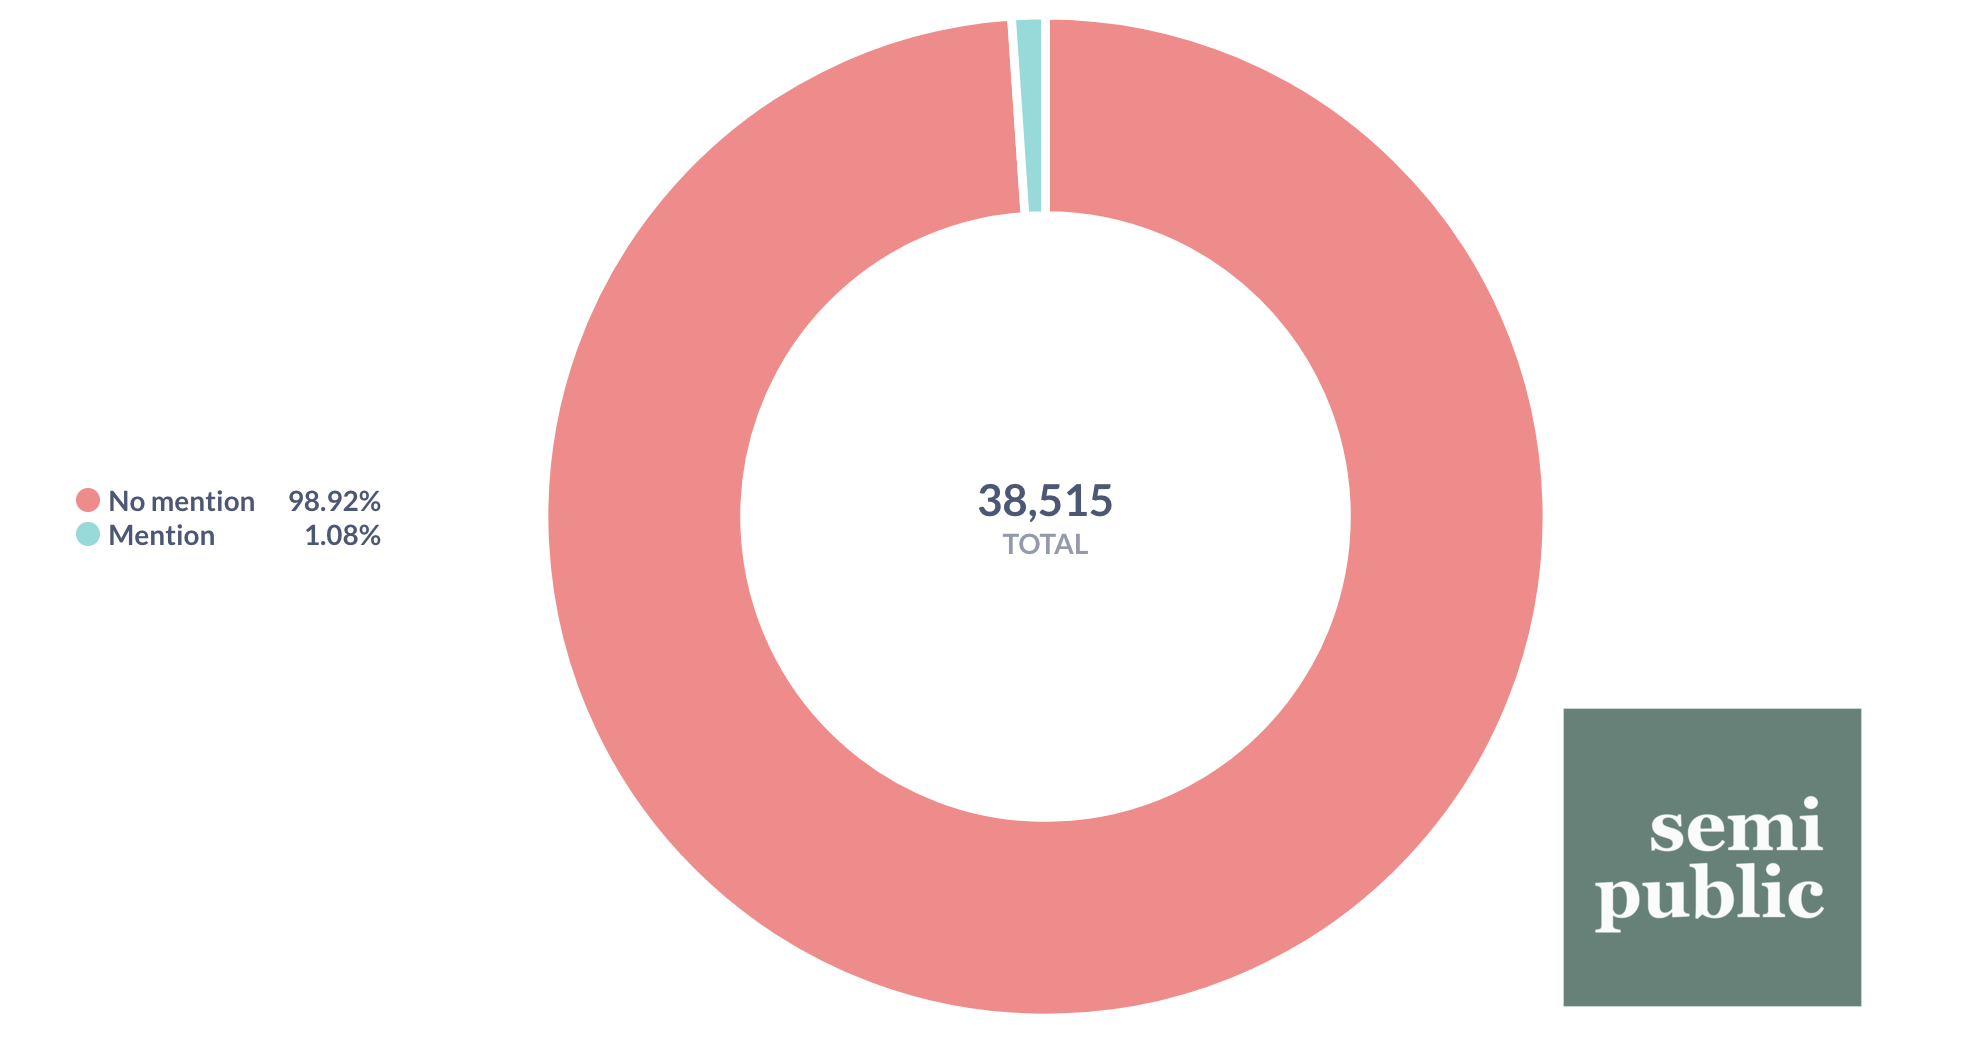
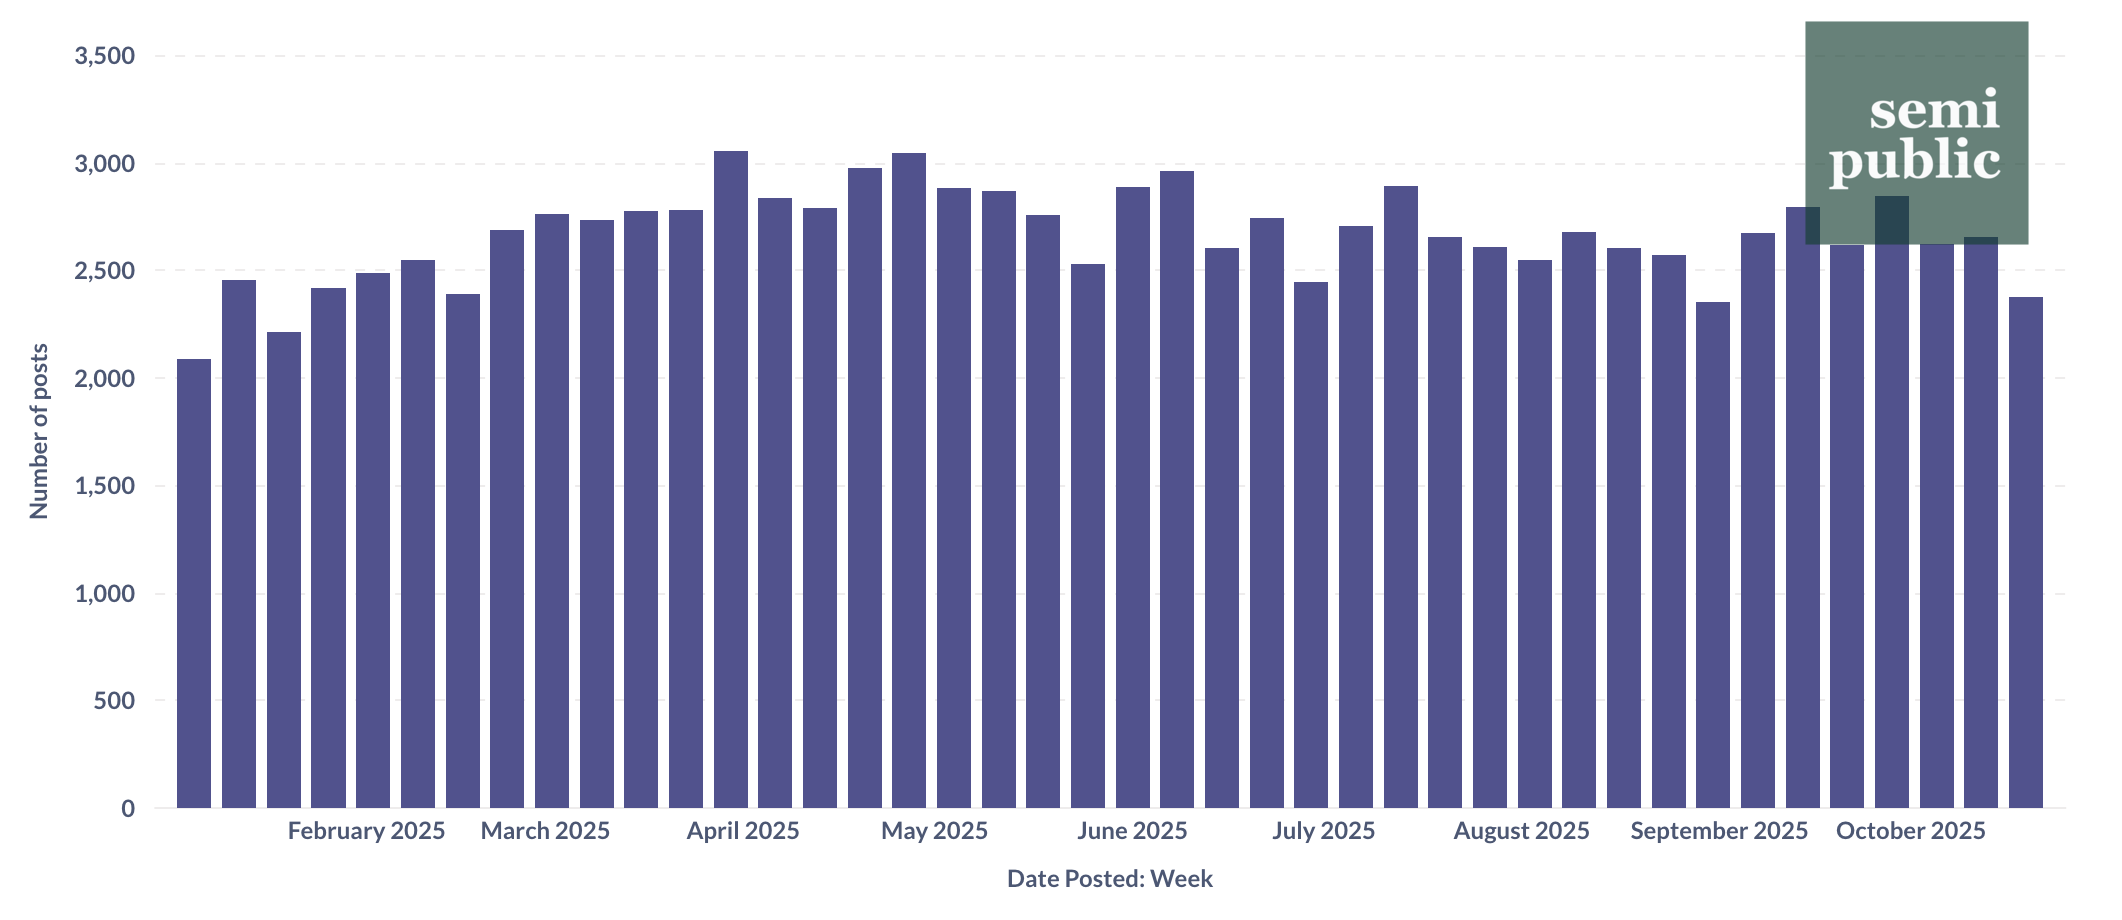
As you can see in the first graph, public media stations post about 2,500-3,000 unique posts a week. Those numbers didn’t seem to be affected at all by the votes to end public media’s federal funding. Even separating out Facebook posts by reference to federal funding or the rescission package between July 18 and now showed an extremely small percentage - barely 1% of 38,000 posts.
But we’re not concerned with total Facebook post output by stations, we want to know what audiences actually responded to, and the best way to calculate that is through engagement rate:
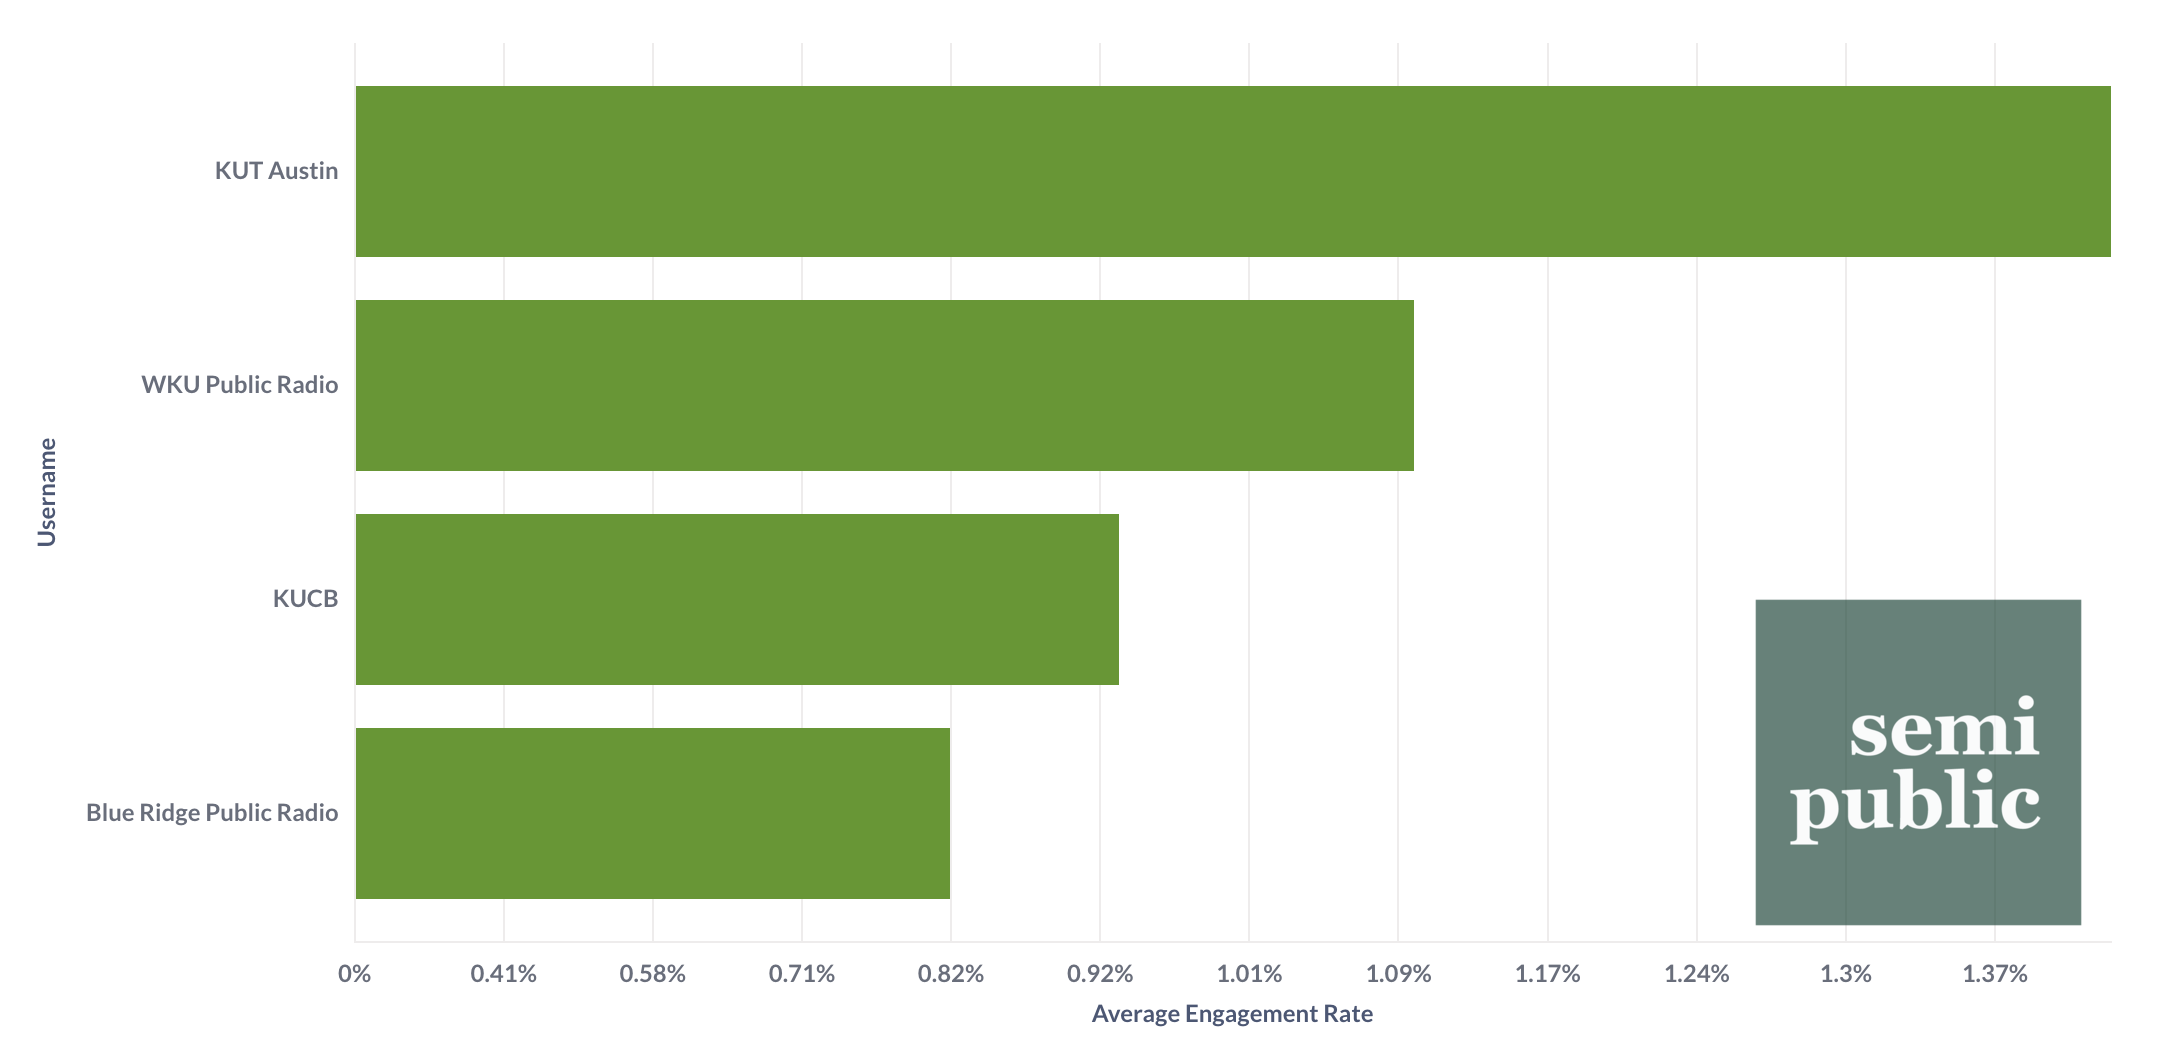
According to social media scheduling app HootSuite, the average engagement rate for posts by the media and entertainment industry in 2025 is 0.8%. Public media’s is much lower at 0.12%. In fact, there were only four stations whose average was above the media and entertainment’s average: KUT Austin, WKU Public Radio, KUCB, and Blue Ridge Public Radio.
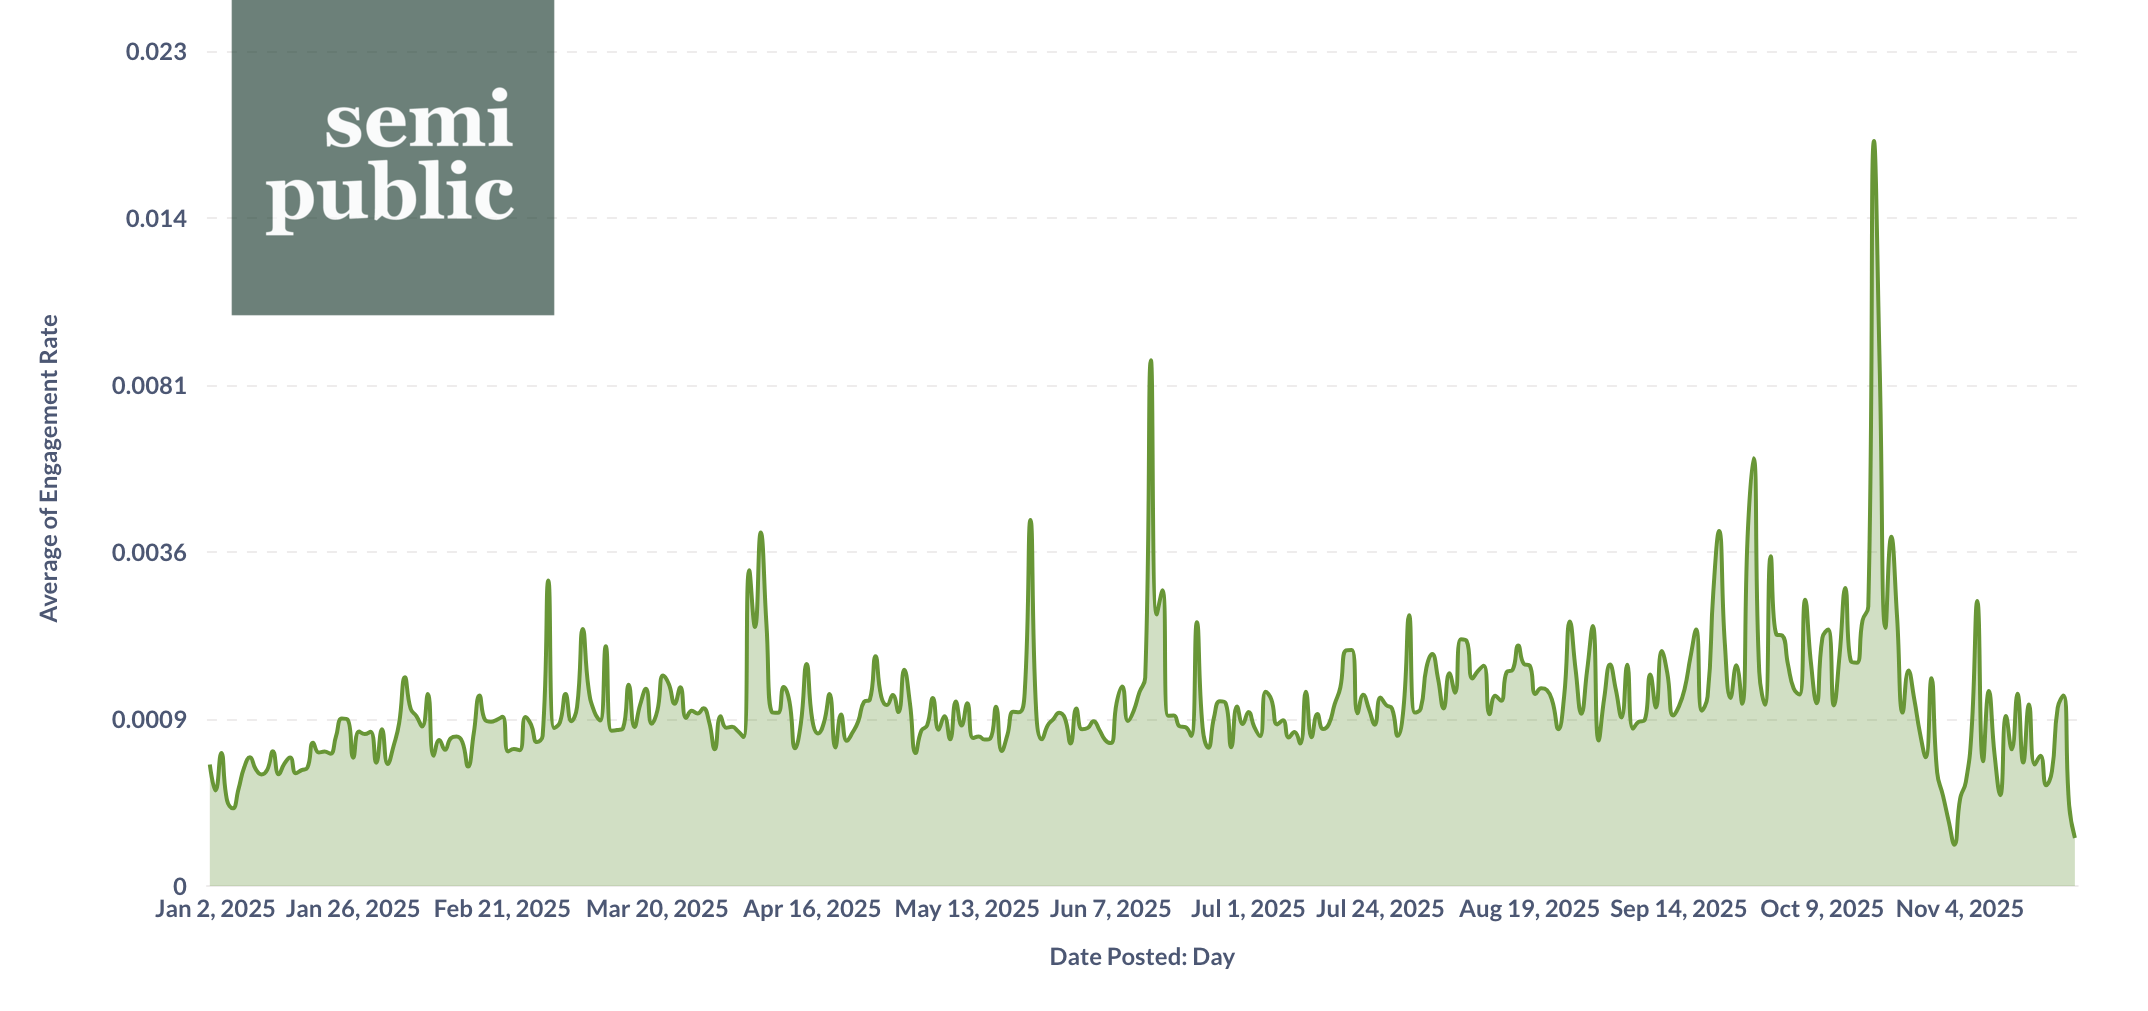
When averaged out by day, there are two that stand out: June 14th and October 18th, two days when No Kings protests were happening nationwide. Users engaged much higher than the public media industry average, and even higher than the media average.
What’s interesting is that the average engagement rate on October 18th, the day of the second nationwide protests, was 1.8%, and the average engagement of posts that mentioned the key words “no kings” had a 4% engagement rate. Compare that to July 18th, which only had a 0.18% average engagement for all public media Facebook posts, and to posts containing the keywords “federal funding,” “CPB,” or “rescission,” which had a 0.47% average engagement.
Just The Beginning For Our Social Media Analysis
What should public media’s social media managers take away from all of this? The good news is that, despite the many challenges facing the industry, there’s still reporting that appeals to public media’s Facebook users and causes them to interact with station many multiples more than usual. The bad news is that the impactful reporting they responded to wasn’t about losing federal funding.
We know individual donations are still up, maybe the hopeful middle ground is that audience members still believe in a show-don’t-tell demonstration of value.
Like I said before, this is only the beginning of our social media analysis. We’ll be turning over Facebook data for deeper insights as well as expanding to other platforms soon. Until then, have a great Thanksgiving!